December 10, 2017 / by Craig Shepherd DevOps
7 DevOps Tools We Love - And 1 We Love To Hate
For many DevOps engineers, the workday is often spent using a variety of tools to be more productive and increase efficiency, and due to the often intensive work it’s important to use tools they can rely on.
The tools below will help collaboration between your team to gain a better understanding of your infrastructure, making it easier to increase reliability, release new features, resolve issues faster and reduce security vulnerabilities. Here are some of the tools we love, and one that we hate.
1. Terraform
Useful for: Infrastructure as Code
 Terraform is a widely-used tool for creating, changing and updating your infrastructure. It enables you to write your infrastructure as code, and visualise your plans before executing changes.
It’s a scalable solution to managing your infrastructure. You may decide to get your feet wet by managing a few virtual machines on AWS, but if you do decide to dive-in later on, it’s capable of handling a huge multi-cloud infrastructure.
When collaborating on infrastructure with a team, it becomes an essential tool, keeping everybody aware of changes to your environments.
2. Ansible
Useful for: Configuration Management
 Ansible has become a firm favourite with many DevOps teams over the years. It makes IT automation and configuration management simple, and it has saved our team hundreds, if not thousands of hours.
Ansible keeps things simple by connecting via SSH to configure your servers, meaning you’re not required to install an agent on your remote machines. Playbooks are written in easy to understand YAML files and executed across the server groups you specify.
With hundreds of modules available, it makes configuration management much simpler.
3. Datadog
Useful for: Application Monitoring & Analytics
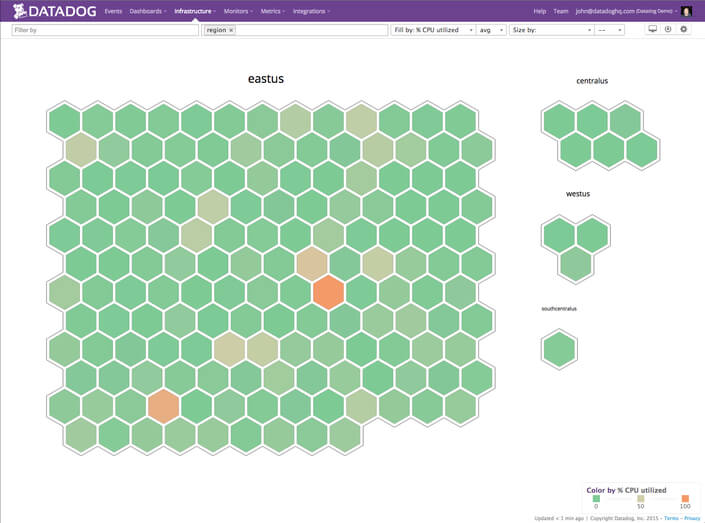
Collecting data from systems, apps and services and displaying it in eye-pleasing dashboards is not easily-done, but Datadog have succeeded. It’s hard to not be impressed by the visuals and ease of using the Host Map.
With a vast range of integrations, Datadog will likely be useful to you and your team.
We’re eagerly awaiting the release of their PHP APM (Application Performance Monitoring), expected to be available in 2018.
4. Packer
Useful for: Automated Machine Images
 Another great tool from the Hashicorp team. Packer is an open source tool for building identical machine images.
Packer can take a single source configuration, and create identical machine images for Amazon Web Services (AWS), Microsoft Azure, Google Cloud Platform (GCP), Digital Ocean and more. Need a Docker, VMware or OpenStack image? No problem! Packer supports them!
We highly recommended Packer when you need to create and deploy consistant machine images throughout your environments. In a multi-cloud architecture, it’s an essential piece of software.
5. Grafana
Useful for: Data Visualisation, Metric Analytics & Visualisation
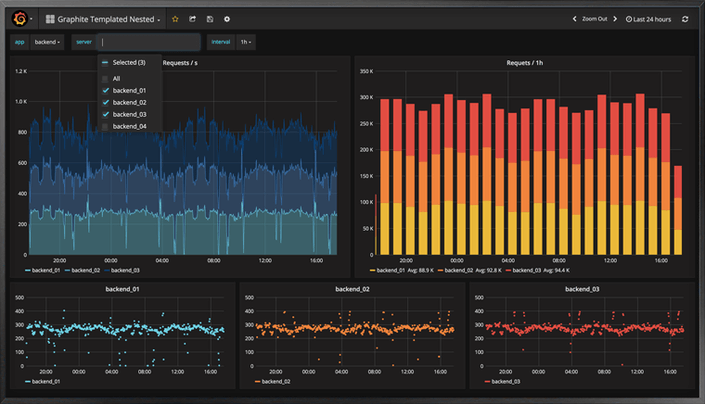
Grafana is an open source software for time-series analytics. It can pull data from multiple sources (including AWS CloudWatch, Elasticsearch, MySQL, Zabbix, etc) and display them in easy on the eye dashboards.
The dashboards are easy to configure, and plugins can be installed to give you a greater variety of data sources and visualisations.
Visualising your raw data is critical to respond to issues before they become major incidents. We have Grafana dashboards on screens around the office, meaning we can quickly see when applications are starting to experience problems.
6. Zabbix
Useful for: Monitoring
 Zabbix is an open source tool, capable of collecting and monitoring metrics from servers, virtual machines and network devices.
If you’re working with an autoscaling environment, the Zabbix API can be utilisted to automatically register and deregister servers as they boot up and later terminated.
There have been huge improvements to the User Interface over the years, but we still find that the interface leaves a lot to be desired. Fortunately, Grafana comes in to save the day.
7. Graylog
Useful for: Open-source log management
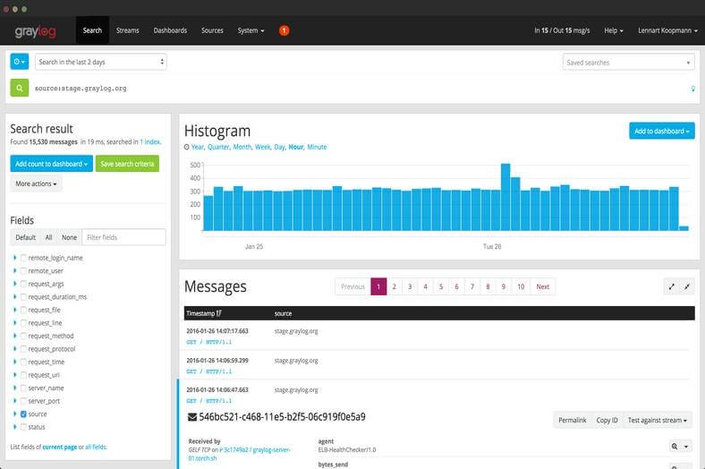
Graylog is a great tool for monitoring applications by collecting syslog and EventLog messages into one central system. By setting alarms for increased error rates and exceptions, you can quickly learn of issues in your environment.
Graylog becomes extremely useful when Information Security standards such as PCI-DSS or HIPAA require you to store logs for a set period of time.
From our experience, Graylog is capable of ingesting millions of messages a day on a single, modest virtual machine but for production systems, we recommend setting up a cluster.
8. PagerDuty
Useful for: Incident Management & Alerts
 I’m being harsh when I say we hate PagerDuty. What I really hate is being woken up at 3am to deal with production environment issues.. but who doesn’t?!
When an issue does occur however, it’s vital that the colleagues who can resolve the issue know about it as soon as possible. PagerDuty does that with automated phone calls, SMS and push notifications to the on-call team responsible for that service.
Useful features include: Unlimited Notifications, On-call scheduling, Incident Stats & Analysis, and a user-friendly mobile app, which is great for responding to incidents with sleepy eyes at 3am.
Conclusion
No tool will automatically make your team more productive, but these services can help improve processes, efficiency and collaboration.
Speak to us today to discuss how we can help you reach your DevOps targets. Use our online form or call us on +44 (0161) 694 7321.


